Here's a look at a Rider Assessment report from the KOM Informatics test environment. The percentiles do not reflect those found in the production!
See also
Home > Reports > Rider Assessment
Rider Assessment
The Rider Assessment report looks at your percentile rankings vs other KOM Informatics users. The rankings pertain to both Performance and Workload. You need to supply your gender to be able to run the report. You can do this from the new [Settings] - [Rider Assessment] page. If you haven't supplied a gender, the system will redirect you to the Rider Assessment Settings page to allow you to do so.
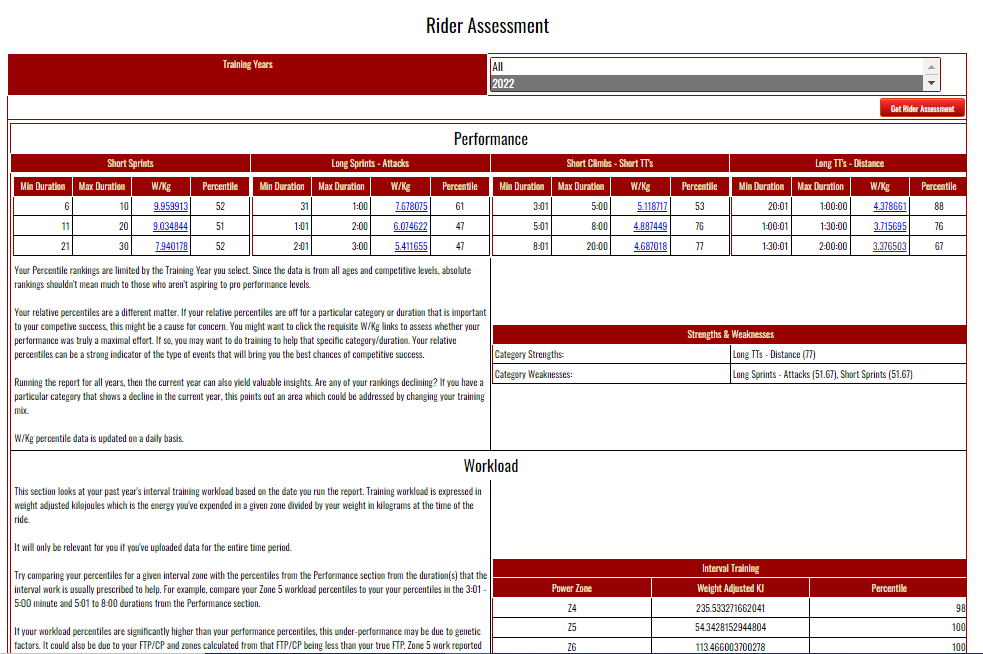
Performance
Performance percentiles look at Watts per Kilogram across 12 different durations divided into 4 categories. The Report displays your strongest and weakest categories.
Your Percentile rankings are limited by the Training Year(s) you select. Since the data is from all ages and competitive levels, absolute rankings shouldn't mean much to those who aren't aspiring to pro performance levels. (At this writing the percentile top anchors are Cat 1 for 6 and 61 seconds, and International Pro for 5:01 and 20:01 when compared to Dr. Coggan's powerprofiling_v4.xls spreadsheet)
Your relative percentiles are a different matter. If your relative percentiles are off for a particular category or duration that is important to your competive success, this might be a cause for concern. You might want to click the requisite W/Kg links to assess whether your performance was truly a maximal effort. If so, you may want to do training to help that specific category/duration. Your relative percentiles can be a strong indicator of the type of events that will bring you the best chances of competitive success.
Running the report for all years, then the current year can also yield valuable insights. Are any of your rankings declining? If you have a particular category that shows a decline in the current year, this points out an area which could be addressed by changing your training mix.
W/Kg percentile data is updated on a daily basis if any higher values (top anchors) or lower values (bottom anchor) are encountered.
Workload
This section looks at your past year's interval training workload based on the date you run the report. Training workload is expressed in weight adjusted kilojoules which is the energy you've expended in a given zone divided by your weight in kilograms at the time of the ride.
It will only be relevant for you if you've uploaded data for the entire time period.
Try comparing your percentiles for a given interval zone with the percentiles from the Performance section from the duration(s) that the interval work is usually prescribed to help. For example, compare your Zone 5 workload percentiles to your your percentiles in the 3:01 - 5:00 minute and 5:01 to 8:00 durations from the Performance section.
If your workload percentiles are significantly higher than your performance percentiles, this under-performance may be due to genetic factors. It could also be due to your FTP/CP and zones calculated from that FTP/CP being less than your true FTP. Zone 5 work reported by the system might not be eliciting typical Zone 5 adaptations as well as might be expected.
Conversely, if your performance percentiles are higher than your workload percentiles, this could point out an area where genetic factors are working in your favor. It might also be the case that you are eliciting Zone 5 adaptations through HIIT modalities such as 30-15's or Tabatas. In most cases this will show up as Zone 6 work.
Workload percentiles data is updated on a daily basis.
Here's a look at a Rider Assessment report from the KOM Informatics test environment. The percentiles do not reflect those found in the production!
See also